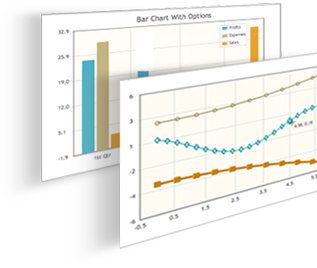
Top 3 javascript chart libraries
HTML 5 JS

HTML 5 Web Apps: Meet and exceed the data visualization needs of your end-users and bring information to life on the web with the HTML 5 JS Widgets that ship as part of DXTREME. HTML 5 Charts, Gauges and RangeSelector along with a full range of multi-purpose widgets such as buttons, lookups, lists and tabs are included in the DXTREME Subscription.
http://demos.devexpress.com/DXTREME/Visualization/#index
ChartJS >> $299 ( per developer )
jqPlot

jqPlot is a plotting and charting plugin for the jQuery Javascript framework. jqPlot produces beautiful line, bar and pie charts with many features
GPL License & MIT License
Highcharts
Highcharts is a charting library written in pure HTML5/JavaScript, offering intuitive, interactive charts to your web site or web application. Highcharts currently supports line, spline, area, areaspline, column, bar, pie, scatter, angular gauges, arearange, areasplinerange, columnrange, bubble, box plot, error bars, funnel, waterfall and polar chart types.
참조 : http://www.splashnology.com/article/15-awesome-free-javascript-charts/325/
